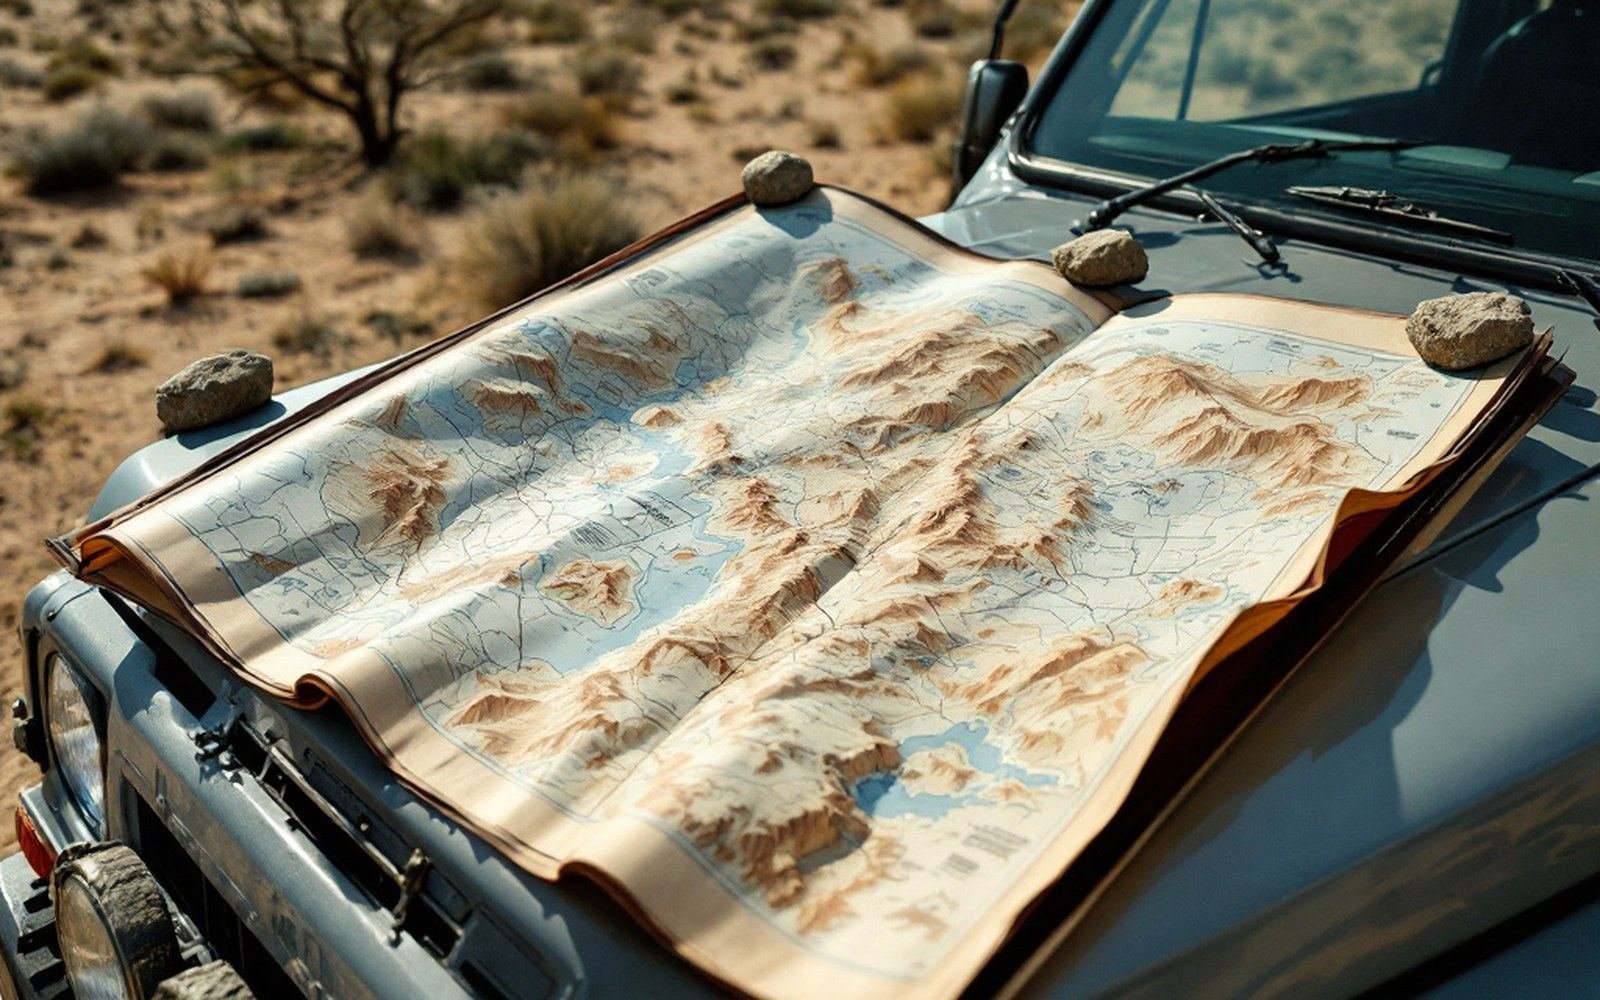
01What a geological map actually is
A topographic map records the shape of the ground. A geological map records what the ground is made of, and how old it is, and how the units relate to one another — and most of those judgements cannot be checked from the surface. The colours and lines that tile a standard quadrangle sheet carry more interpretive weight than they suggest. Every contact, the boundary between one mapped unit and the next, represents a decision made in the field, often from a hand lens and a compass bearing on a dry hillside, later revised at the desk when adjacent sheets failed to agree.
In the Albuquerque Basin, the mapping problem is unusually acute. The basin itself is a structural depression — crust pulled apart along a chain of normal faults since the Oligocene — and most of its interior is buried under several kilometres of its own erosional debris. The New Mexico Bureau of Geology and Mineral Resources and the United States Geological Survey have both run systematic mapping campaigns across this ground, and their published quadrangles represent decades of revision against new borehole data, seismic profiles and, more recently, satellite imagery.
02Reading the contacts
The productive zones on a basin map are the contacts: fault scarps, unconformities, and the edges of volcanic flows. On the West Mesa, the contact between the basalt flows and the underlying Santa Fe Group sediments is not simply a line — it is an inferred boundary, traced across a surface where the younger rock has been stripped by erosion or buried by alluvium. Where the escarpment exposes it cleanly, mappers can measure dip and strike; everywhere else, the contact is a reasoned guess constrained by elevation, gravity anomaly data and what the drill cores say.

The fault contacts around the Sandia Mountains are particularly instructive. The Sandia fault system has dropped the basin floor thousands of metres relative to the granite core of the range, but the fault trace at the surface is locally covered by alluvial fans spilling off the mountain front. The USGS National Geologic Map Database holds successive generations of quadrangle maps for this area, and comparing them across decades reveals how the interpreted fault location has migrated as new data arrived — not through error, but through the normal progress of inference tested against evidence.
Volcanic units present a different challenge. The Bandelier Tuff, erupted from the Valles Caldera in two main pulses around 1.6 and 1.25 million years ago, blanketed the landscape to the north and west of the basin in a sheet that weathers into the pale, sculpted terrain visible at Bandelier National Monument and Kasha-Katuwe Tent Rocks. Mapping tuff requires distinguishing welded from non-welded facies — welded tuff behaves mechanically like rock; the non-welded equivalent erodes rapidly into soft columns and fins — and the contact between them in a single outcrop can be gradational over just a few metres.
The productive zones on a basin map are the contacts: fault scarps, unconformities, and the edges of volcanic flows.
03The living map
No geological map of the Albuquerque Basin is finished. Continuous GPS networks operated by UNAVCO measure horizontal and vertical motion at millimetre-per-year precision, and that motion — the basin floor subsiding relative to the surrounding ranges, the crust stretching west-northwest — gradually shifts where the active fault traces must be. Seismic monitoring by the Incorporated Research Institutions for Seismology adds hypocentre locations that sometimes fall on faults no surface mapper had identified. Beneath Socorro, a large body of magma in the mid-crust deforms the ground above it measurably; the surface expression of that deformation was recognised only after geodetic networks grew dense enough to resolve it.
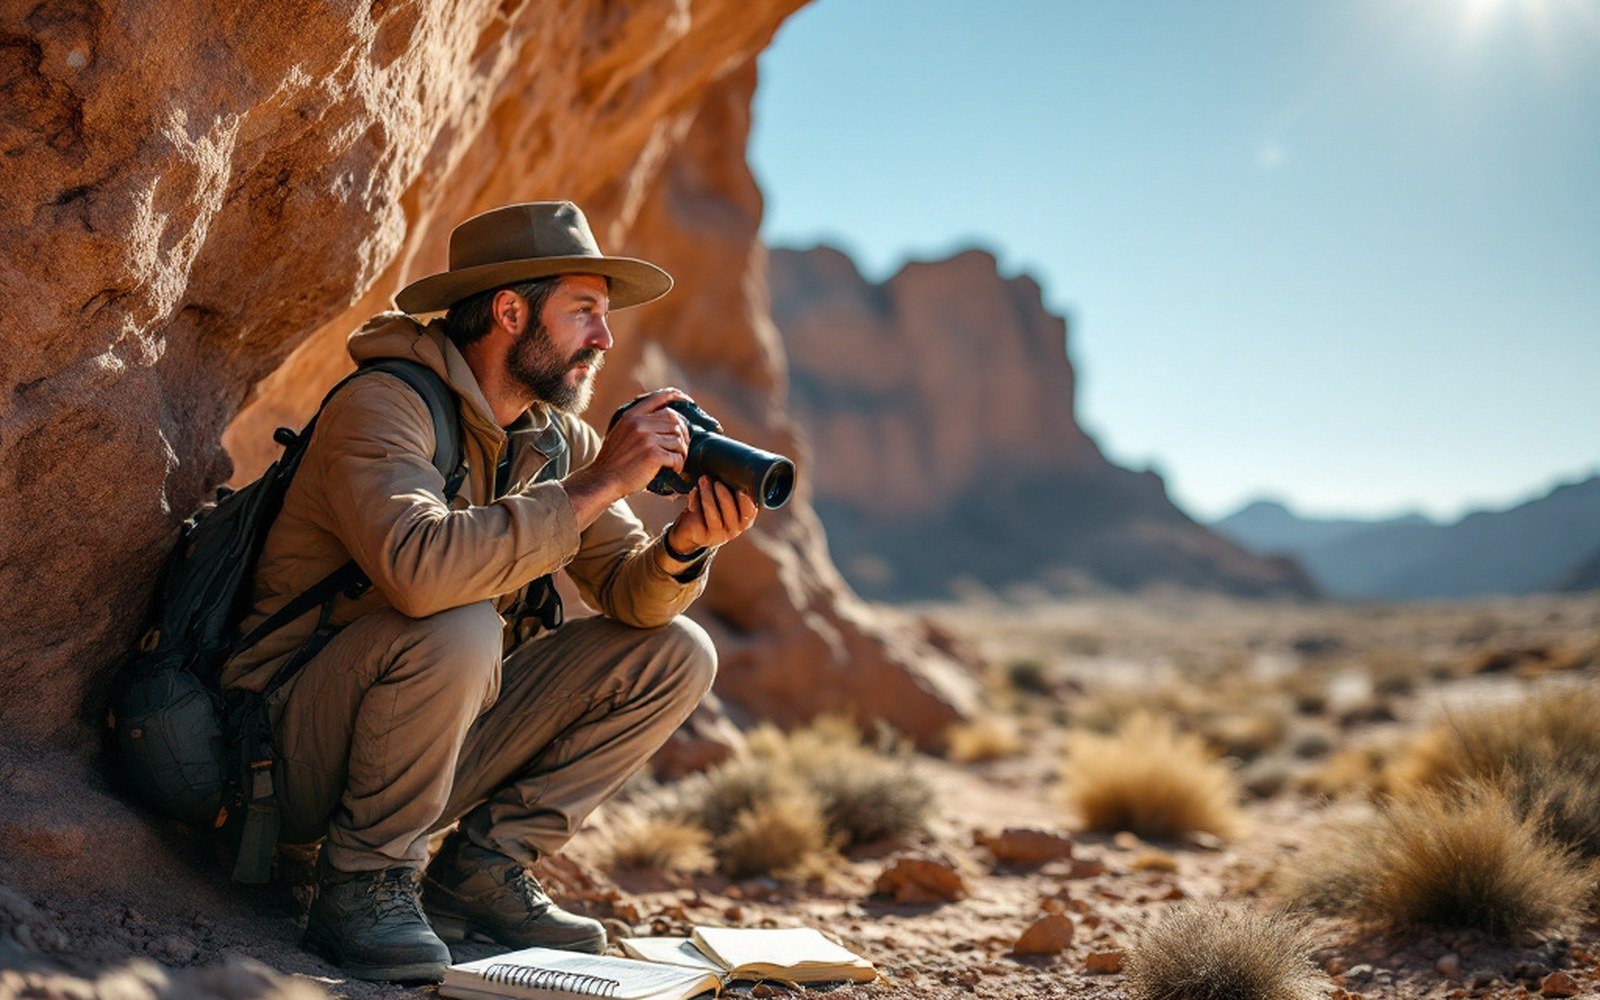
The map, in other words, is not a record of what is known but a current statement of best interpretation — a document that improves as instruments improve and as mappers return to argue with what the last generation drew.